September 16, 2022 Azure Azure Log Analytics Grafana Metrics Development Cloud
Not too long ago I got into building a metrics dashboard for our resources in Azure. Specifically, we’re running our applications in Azure Kubernetes Services and want to have a dashboard to track how everything is doing. Since we already have our logs emitted to Azure Log Analytics we could use that to build our metrics.
Writing the queries to fetch our data from Log Analytics is rather straight forward. However, the graphs it produces aren’t as interactive as we would like it to be.
Also, in the future we would like to be able to easily ingest data from other sources as well. Therefore, we started evaluating the use of Grafana to render the graphs.
We would still write our queries in Kusto - Azure Log Analytic’s query language - but after that let Grafana render this data in a dashboard.
One issue we quickly ran into is that the Grafana plugin for Log Analytics doesn’t support render the data you would get with make-series straight out of the box.
An example of make-series
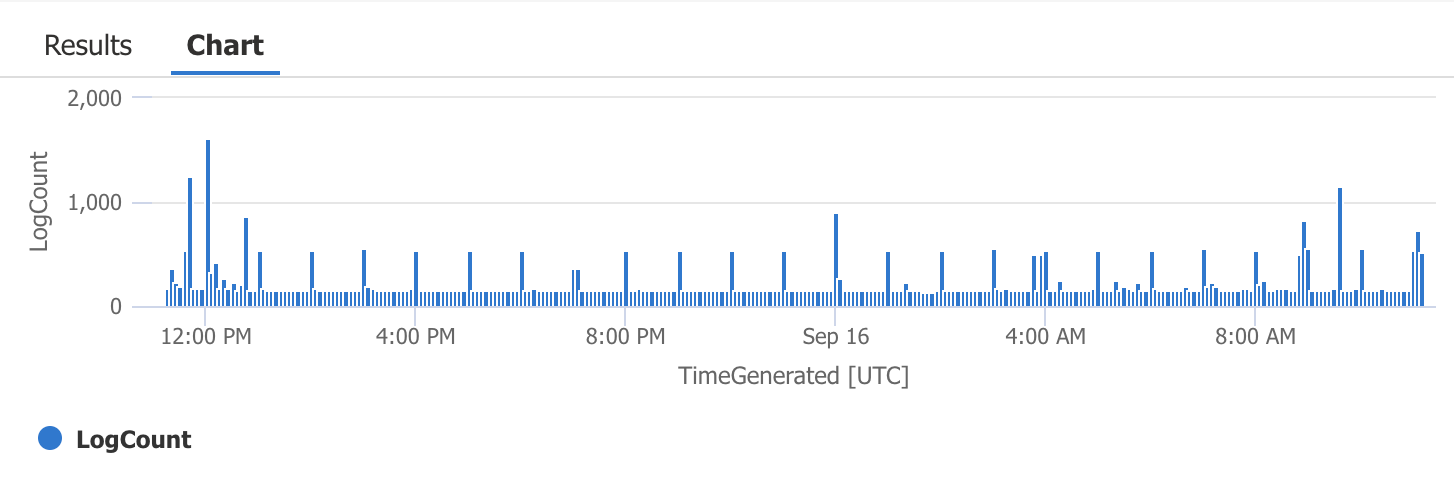
For reference, here’s a small query using make-series and how it’s rendered in the Azure Portal:
ContainerLog
| make-series Count=count() on TimeGenerated from ago(1d) to now() step 5m
Transforming make-series data
Luckily, we can use our Kusto-foo to transform the data from make-series to be in a format Grafana can handle.
The trick is to “expand” the make-series data - similar as to how zip works in Python - to go from the lists of measurements we received from make-series back into individual rows.
We can do that by adding the following the lines to our query.
// Expand all data into individual rows
| mv-expand Series, TimeGenerated
// Map each column from the "dynamic" type back into the type we expect
| extend Series=todecimal(Series), TimeGenerated=todatetime(TimeGenerated)
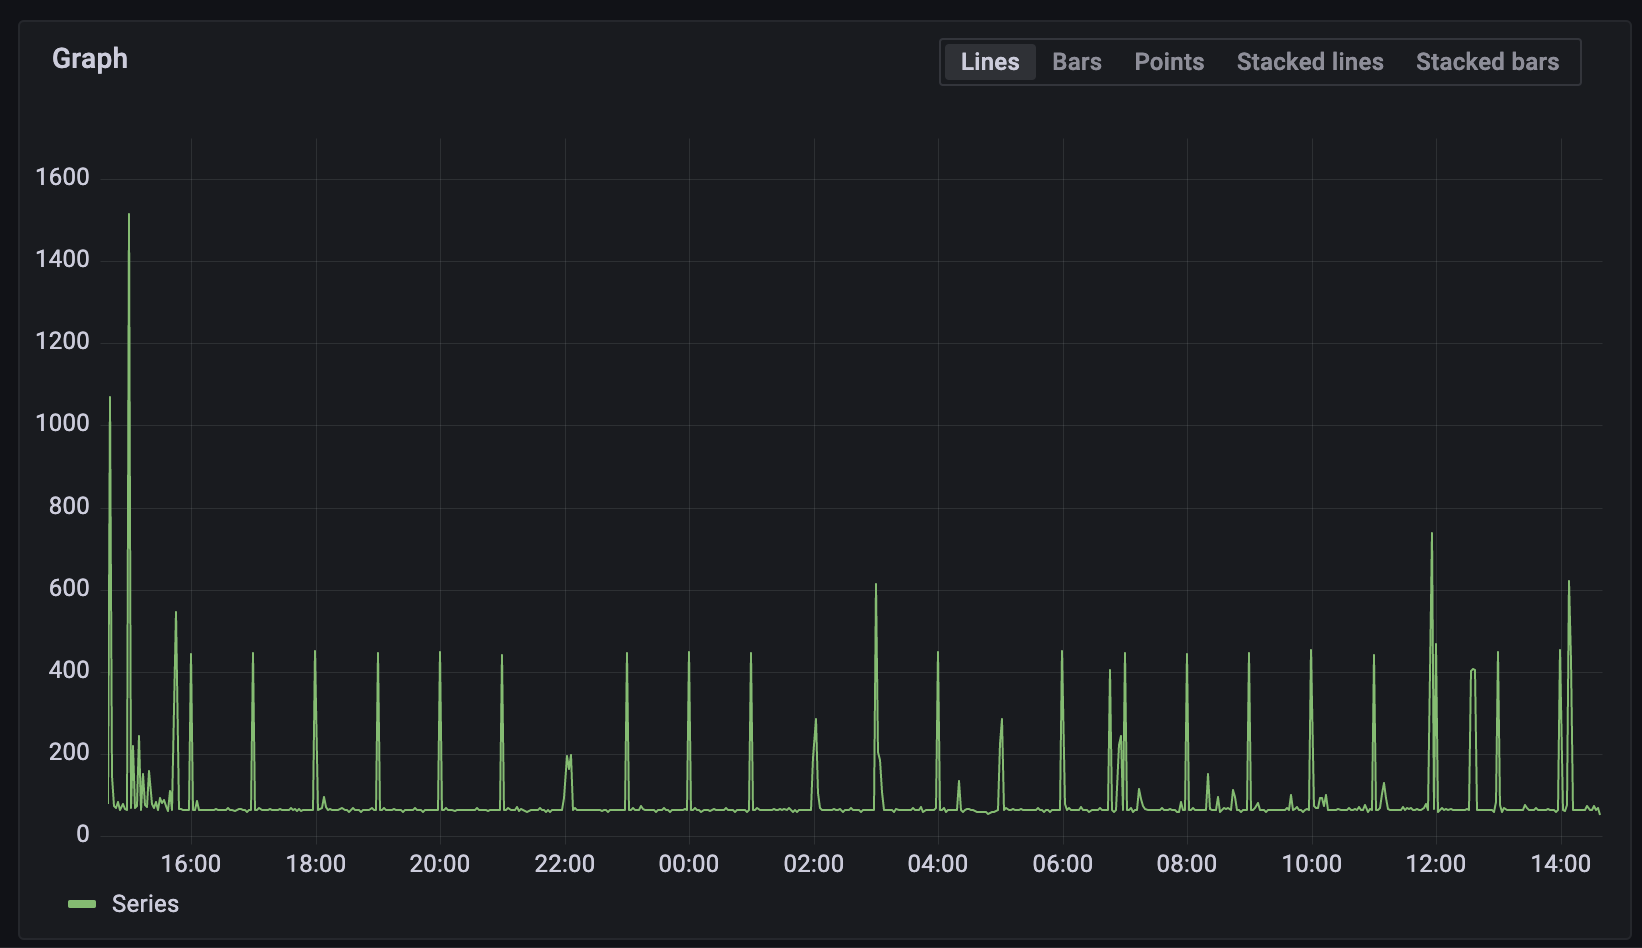
The resulting query, including the Grafana specific magical placeholders, would be:
ContainerLog
| make-series Series=count() on TimeGenerated from $__timeFrom() to $__timeTo() step $__interval
| mv-expand Series, TimeGenerated
| extend Series=todecimal(Series), TimeGenerated=todatetime(TimeGenerated)
Now, Grafana can render our data just fine as time-series 🎉 .